


Local Energy and Emissions Monitor

- built for action.

LEEM provides LGA-level carbon emissions data for every Australian council — from 2000–01 to today. Built on NIEIR’s regional economic model and reconciled to Australia’s national greenhouse gas inventory.

543

Australian LGAs covered

24

Years of time-series data

86

Industry sectors modelled

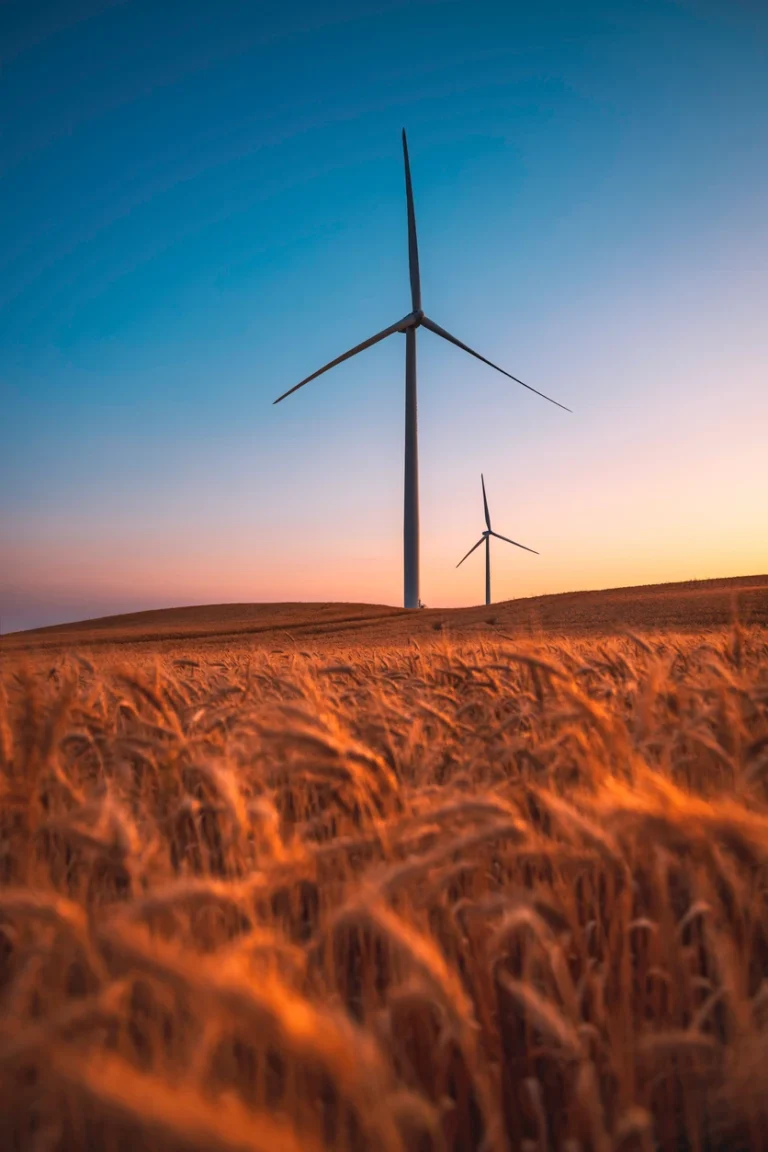
Wind turbines in rural farmland at sunset representing renewable energy markets, regional economics and industry forecasting in Australia.

Access 24 years of energy use and emissions data for local areas

Annual time-series from 2000–01 to 2023–24, updated each year.

Monitor climate impact activity from 86 local sectors

Emissions by ANZSIC subdivision — from Road Transport to Food Manufacturing — plus residential.

Align local data with all state and national agencies

Fully consistent with Australia’s national greenhouse gas inventory and state reporting frameworks — defensible at every level of government.
Energy use and transport emissions in the Sydney Mid West region

THE CHALLENGE

You can't hit targets you can't measure

Decision makers across government, planning and research face growing pressure to measure and report on carbon emissions — yet the data infrastructure has not kept pace. National accounts exist at state level but offer little guidance when you’re trying to set a defensible baseline or benchmark your performance against neighbouring communities.

Existing approaches force a difficult choice: use national figures too coarse to act on, commission expensive one-off studies that can’t be updated annually, or rely on estimates that won’t withstand scrutiny.

LEEM resolves that problem with the following:

WHAT IS LEEM

Detailed energy and emissions data for every community in Australia

LEEM reproduces national greenhouse gas inventories at LGA level across 86 industry subdivisions plus the residential sector. Available as a report, a licensed dataset or as the foundation for custom analytical work.

OPTION 01

MOST POPULAR FOR LOCAL GOVT

Local Area Profiling

A publication-ready PDF covering all major emissions sectors for your LGA, with charts, benchmarking and reduction opportunities. Approximately 80–90 pages.

Best for: local councils, consultants, planning teams

OPTION 02

MOST POPULAR FOR STATE & RESEARCH

Licensed Data Tables

The full underlying dataset — structured Excel workbooks covering emissions by sector, industry and year. Licence access for a single LGA, your state, or the entire national dataset.

Best for: state agencies, universities, research institutions

OPTION 03

FOR SPECIFIC OR MULTI-REGION NEEDS

In-Depth Analysis & Advisory

Deep-dive analytical work built on the LEEM dataset — bespoke modelling, scenario analysis, sector deep-dives or advisory briefings tailored to your organisation’s specific policy or investment questions.

Best for: state agencies, infrastructure teams, large consulting firms

SEE IT IN ACTION

What LEEM reveals - a sample from Merri-bek Council

Our published LEEM report for Merri-bek shows the kind of insight available for any of Australia’s 543 LGAs.

SAMPLE LGA
Merri-bek Council
2000-01 to 2023-24

Total emissions – Merri-bek Council

kt CO2-e : 2000-01 to 2023-24 : Source: NIEIR LEEM

25250_Merri-bek_total
Figure 1 · Community profile — Merri-bek, 2023–24
Typology
IndicatorValue
Population & Housing
Population184,150
Households73,930
Dwelling stock81,526
Houses / Flats66.7% / 33.3%
Economy & Employment
Gross Regional Product$7.9B
Resident employment110,518
Jobs within LGA52,735
Avg resident income$91,377
Figure 2 · Total emissions snapshot — Merri-bek, 2023–24
Emissions

881.1

kt CO₂-e total emissions, 2023–24

↓ 32.1% below 2018–19 · ↓ 18.1% since 2004–05

4.8 t

Per capita emissions

↓ 38% since 2004–05

45.1 %

Renewable electricity share

↑ from 6.6% in 2009–10

64.1 %

Residential share of total

↑ from 57.6% in 2004–05

327.3 kt

Transport emissions

↑ 23.2% since 2004-05

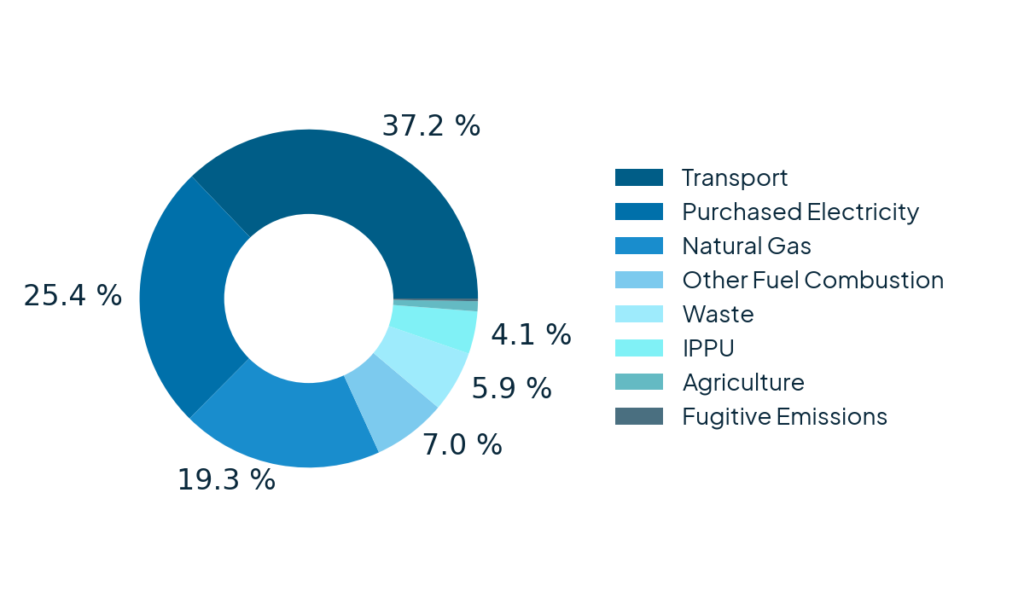
Figure 3 · Emissions share by sector — Merri-bek, 2023–24
Figure 4 · Benchmarking & comparitive performance, 2023–24

115th

Per capita emissions rank
Out of 543 Australian communities · Lower is better

161st

Economic emissions intensity rank
kg CO₂-e per dollar of GRP · Lower is better
vs. averages
Merri-bek per capita 4.8 t
Victorian average ~7.2 t
National average ~9.4 t
Merri-bek performs well below both state and national averages
Reflecting high urban density, active transport uptake and rapid solar adoption

Ready to see your LGA’s emissions picture?
Get in touch — we’ll discuss the right format and provide indicative pricing with no obligation.

WHAT'S IN THE DATA

Available for every Australian community

Select any community below to see its emissions trend. This is a headline taster — a full LEEM report goes much deeper, covering 9 carbon categories, 86 industry sectors and benchmarks against state and national averages.

EMISSIONS PER CAPITA OVER TIME

tonnes CO₂-e per person · 2000–01 to 2023–24. Based on NIEIR LEEM data.

Select a region to view data

WHAT'S MEASURED

Eight carbon categories across every sector of your community

Every energy source, every industry, every year — from household gas use to commercial electricity to road transport.

Electricity

Purchased electricity & renewable generation share

Gas & Other Fuels

Split into natural gas and other fuel combustion.

Transport

Road and air transport, fleet composition & EV penetration

Fugitive Emissions

Unintended leaks, releases or losses from fuel industries

Industrial Processes and Product Use

Non-energy industrial processes & direct emissions from product use

Agriculture

Direct emissions from livestock & farm management

Land Use, Land Use Change and Forestry

Forest, cropland, grassland, wetland, settlments and harvested wood products

Waste

Solid Waste Disposal, Wastewater Treatment and Other Waste

Benchmarks

Per capita & economic intensity vs state & national

WHO USES LEEM

Built for those driving climate action

Local Government

Defensible, annually updated emissions baselines for climate planning, community reporting and state government submissions.

State Government & Agencies

Multi-LGA licensed datasets for cross-jurisdiction benchmarking, policy evaluation and investment targeting.

Advocates, Agencies & Associations

NGOs, industry bodies, energy authorities, mining companies, environment agencies and sector associations with a specific interest in climate, energy or emissions — across the full spectrum from resource sector operators to environmental advocacy organisations.

Researchers & Academia

24 years of nationally consistent LGA-level panel data — ready for integration into academic models and policy analysis.

WHAT LEEM IS USED FOR

Where our clients put LEEM to work

From first baseline to long-term transition planning

01 · MEASURE

Setting a defensible net zero baseline

Every credible climate commitment starts with a number that has been independently derived, is consistent with national accounting, and can withstand scrutiny. LEEM provides that foundation.

02 · TRACK

Annual emissions tracking against plan milestones

LEEM is updated annually — giving councils a consistent, like-for-like time series that shows whether emissions are actually falling, and in which sectors, year after year.

03 · COMPARE

Peer council benchmarking

Because LEEM uses the same methodology for every Australian LGA, it enables genuine apples-to-apples comparison — invaluable for councils making the case for investment, and for state agencies allocating resources.

04 · PLAN

Climate action plan evidence base

LEEM provides the sectoral breakdown, trend history and industry-level detail that turns a well-intentioned climate action plan into a genuinely evidence-based strategy.

05 · PROJECT

Decarbonisation pathway modelling

Use LEEM’s 24-year historical picture to map realistic transition pathways for your community — showing what different rates of electrification, renewable uptake and land use change mean for emissions between now and 2050. The data to underpin a roadmap, not just a target.

06 · IMAGINE

What would you build if you had the full picture?

Every credible climate commitment starts with a number that has been independently derived, is consistent with national accounting, and can withstand scrutiny. LEEM provides that foundation.

METHODOLOGY AND TRUST

Built on rigorous, defensible foundations

LEEM uses NIEIR’s regional input-output framework — distributing national emissions accounts to LGA level using detailed economic activity data, fully reconciled to Australia’s official National Greenhouse Gas Inventory.

Economy and industry focused input-output modelling

Estimated bottom-up from regional economic flows — not distributed from national averages — so each LGA reflects its actual industrial structure.

LGA specific activity indicators

Calibrated using activity indicators for each sector including electricity and gas usage, motor vehicle stock, waste streams, land use, population and dwelling stock

Reconciled to national inventory

All LGA data is tied back to  national, state and territory greenhouse gas emissions inventories — including sectoral and industry accounts.

Scope 1, 2 & 3 treatment

Carbon emissions modelled to households and businesses responsible for them. Electricity Scope 2, Transport Scope 1, Waste Scope 3.

LEEM draws on energy, transport and industry data from across Australia’s national statistical and regulatory agencies.

data sources integrated

ABS

Distribution & Transmission Networks

Regulatory Bodies

AEMO

Municipal Waste

Emissions Inventories

Energy Statistics

While the National Institute endeavours to provide reliable forecasts and believes the material is accurate, it will not be liable for any claim by any party acting on such information. All LEEM estimates are indicative and should be read in conjunction with the accompanying methodology documentation.

GET STARTED

Access LEEM in the format that works for you

Tell us which LGA or region you’re working with and what you need. We’ll discuss whether local area profiling, a data licence or in-depth analysis best suits you — no obligation.

Or email admin@nieir.com.au directly

Latest Energy & climate news