New analysis shows EV ownership strongly linked to income and geography
by Brad Vakulcyzk
Key Data Insights
| Electric vehicles are now present in more than 80% of Australian communities, but adoption continues to be dominated by higher-income metropolitan households.
Analysis using NIEIR’s Local Energy and Emissions Monitor (LEEM) shows:
|
Income vs Electric Vehicle Adoption
The average electric vehicle owning household in Australia lives in a Local Government Area with average household income of around $150,000, a pattern that has remained broadly consistent for the past seven years. In 2025, the average EV-owning household lives within the top 22 per cent of LGAs by average household income. This represents only a modest shift compared with 2023, when EV owners were concentrated within the top 25 per cent of LGAs, and the years immediately following the onset of the COVID-19 pandemic.
The 2023 year is also notable as the first full year following the introduction of the Fringe Benefits Tax (FBT) exemption for electric vehicles (1 July 2022), a policy widely regarded as disproportionately benefiting higher-income households through novated lease and salary sacrifice arrangements. At the same time, battery electric vehicle (BEV) registrations have surged across Australia. National registrations increased from 79,034 vehicles as of 31 January 2023 to 259,208 vehicles by 31 January 2025. A further 100,000 BEVs are estimated to have been sold during 2025 (including January).
Analysis presented here combines motor vehicle registration data with regional income data using NIEIR’s Local Energy and Emissions Monitor (LEEM), allowing EV adoption to be examined alongside economic and demographic conditions across Australia’s local economies.
Early Adoption Concentrated in High-Income Metropolitan LGAs
In the earlier years of modern electric vehicle adoption, when relatively few vehicles were sold nationally, uptake was highly concentrated in high-income metropolitan areas.
This pattern remains evident today. Some of the highest concentrations of BEVs in Australia continue to occur within inner Sydney LGAs surrounding Sydney Harbour. These LGAs continue to record the highest share of BEVs relative to total motor vehicles garaged across the country as of 2025:
Figure 1: Share of BEVs in total motor vehicle registrations by LGA, Sydney Metropolitan, 2025
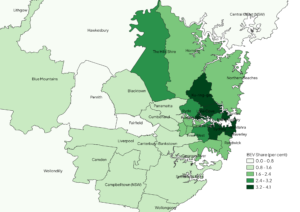
Source: NIEIR; BITRE, Road Vehicles Australia
Figure 2: Share of BEVs in total motor vehicle registrations by LGA, Melbourne Metropolitan, 2025
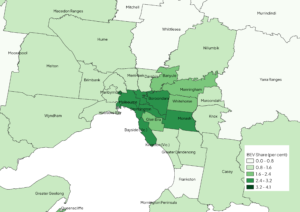
Source: NIEIR; BITRE, Road Vehicles Australia
EV Ownership is Spreading Geographically
While adoption remains concentrated among higher-income households, EV registrations have become much more geographically dispersed across Australia.
In 2017, only around 40 per cent of LGAs recorded any battery electric vehicles. By January 2025, this had increased to around 83 per cent of LGAs, meaning EVs are now present across most local economies in Australia. However, the intensity of adoption varies significantly between regions.
A Clear Metropolitan Advantage
Electric vehicle adoption remains strongest within metropolitan regions. In 2025:
| Region | BEV Penetration (2025) |
| Metropolitan LGAs | 1.52% of total motor vehicles |
| Regional LGAs | 0.89% |
| Rural LGAs | 0.39% |
This means metropolitan areas currently have around four times the EV penetration of rural regions.
Figure 3: Share of BEVs in total motor vehicle registrations by region
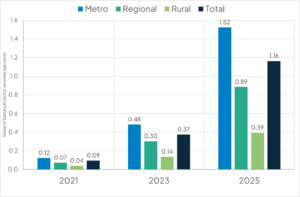
Source: NIEIR; BITRE, Road Vehicles Australia
Income Remains a Key Driver of EV Adoption
Income is one of the major factors influencing current BEV adoption rates. However, income is also a strong determinant of new car purchases across all fuel types, not just electric vehicles. The key difference is that the BEV market remains relatively young, and the second-hand EV market remains comparatively small, limiting access for lower-income households wishing to purchase an EV.
Other factors also influence regional differences in EV adoption, including:
Previous studies by NIEIR have also identified lower adoption of EVs along key public transport corridors, where households may rely less on private vehicles compared with outer suburban regions.
Figure 4: Battery Electric Vehicle penetration compared to average household income, Metropolitan LGAs, 2025
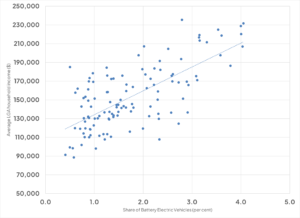
Source: NIEIR; BITRE, Road Vehicles Australia
Lessons from the Solar PV Adoption Curve
The early stages of EV adoption show similarities to the development of the small-scale solar photovoltaic (PV) market. In the early adoption phase of small-scale PV systems (around 2010–2011), uptake was initially concentrated among higher-income inner city households. Early adopters of new technologies are often households with higher disposable incomes capable of absorbing higher upfront costs.
As the cost of PV systems declined over time, installations began expanding into outer suburban areas and eventually regional communities. EV adoption may follow a similar trajectory.
Outer Suburban Areas as Future Growth Centres
Outer suburban regions often contain characteristics favourable to EV adoption. For solar PV systems, large outer suburban homes typically provide greater roof space for installations.
For EVs, these regions are more likely to provide:
These structural factors may support stronger EV adoption in outer suburban regions over time. However, small-scale PV incentives have historically been far more generous than those currently available for electric vehicles. As a result, the EV market continues to be driven primarily by higher-income households that are able to purchase new vehicles.
Policy Settings Shaping EV Adoption
Most EV incentives currently available in Australia focus on tax reductions rather than direct purchase subsidies.
At the Federal level, the most significant measure is the Fringe Benefits Tax exemption for EVs under the luxury car tax threshold, which incentivises novated leases and company vehicle purchases. There has been no direct Federal subsidy applied to the purchase price of EVs. Some states and territories previously offered discounts on registration and other on-road costs, though many of these programs are now being wound back.
Historically, Australia has tended to favour tax concessions rather than direct subsidies. Direct purchase subsidies could be interpreted as subsidising the manufacture and importation of foreign motor vehicles, particularly following the decline of domestic car manufacturing. Some states, including Western Australia and Tasmania, previously offered limited purchase subsidies, though these programs have now closed.
Fleet Purchases and the Second-Hand EV Market
The Fringe Benefits Tax exemption can be interpreted as targeting a specific segment of the population — namely higher-income individuals and households with access to salary sacrifice arrangements, novated leases, and company vehicles. However, it is important to note that the new car market in Australia is heavily influenced by business and fleet purchases. Fleet vehicles are typically held for short periods (1–5 years) before entering the second-hand vehicle market.
While the policy may initially benefit higher-income households, it may also expand the future supply of second-hand EVs, improving accessibility for lower-income households over time.
The Takeaway
|
This analysis highlights that while electric vehicle adoption is expanding across Australia, the transition remains uneven and continues to reflect broader economic patterns in new vehicle purchasing. The findings reinforce the importance of understanding how income, infrastructure and policy settings interact to shape the pace and distribution of adoption. For governments, infrastructure providers and industry, these patterns have direct implications for charging infrastructure planning, electricity demand forecasting and regional transition strategies. |
About the Data
This analysis draws on NIEIR’s Local Energy and Emissions Monitor (LEEM), which tracks energy use, emissions and transport trends across Australia’s Local Government Areas. LEEM enables detailed analysis of how the energy transition is unfolding across different regions and communities.
For more information, contact NIEIR at info@nieir.com.au or visit nieir.com.au
Notes
References
Bureau of Infrastructure and Transport Research Economics (BITRE), Road Vehicles Australia, January 2025 (and previous issues)
ABS Motor Vehicle Census
NIEIR regional economic databases and Local Energy and Emissions Monitor (LEEM) click HERE to visit the NIEIR website and learn more