The ten Local Government Areas (LGA) with the highest total emissions in 2023-24 represent almost a quarter of Australia’s annual emissions. The following analysis excludes the impact from Land Use, Land Use Change and Forestry (LULUCF), which has been a net reduction in Australia’s emissions accounts since 2014-15.
The data is from NIEIR’s Local Energy and Emissions Profile, which reports community emissions within each LGA across Australia for 86 commercial and industrial sectors as well as the residential sector.
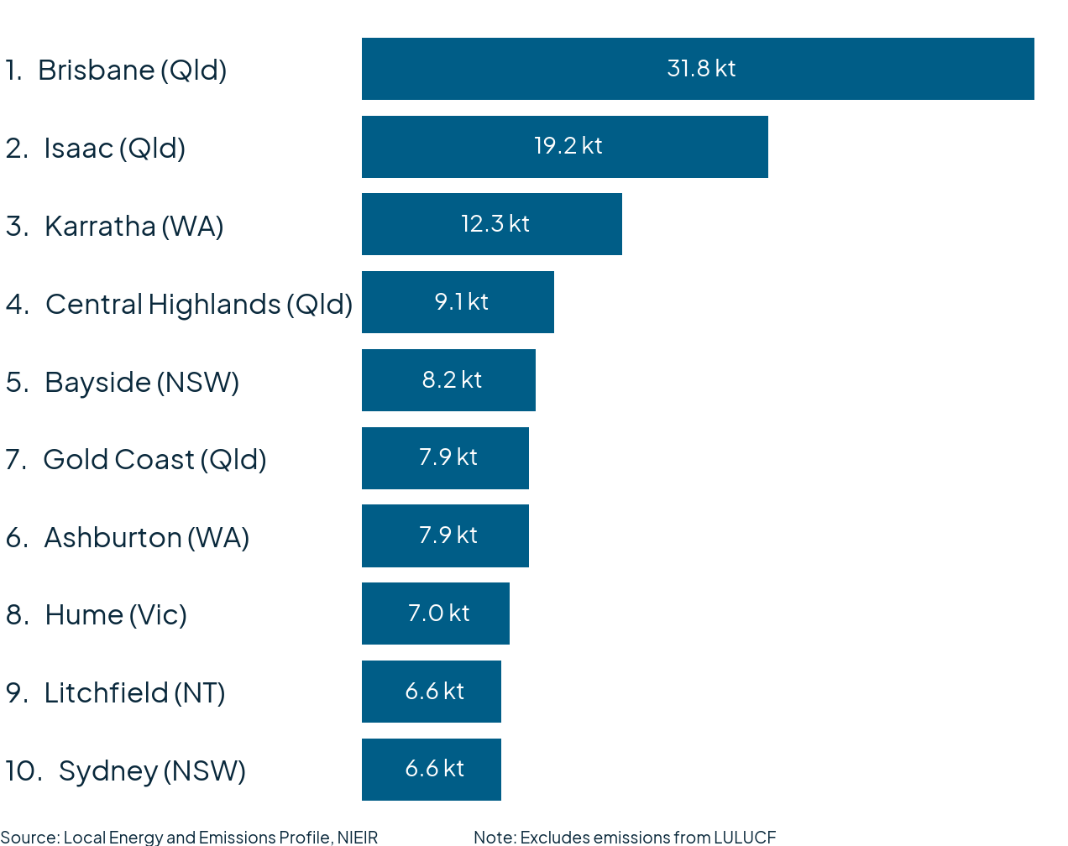
Brisbane had the highest total emissions in 2023-24, followed by Isaac in Queensland and Karratha in Western Australia. Brisbane had annual emissions of 31.8 Mt of CO2-e, which represented around 6.1 per cent of Australia’s annual emissions from businesses and households (excludes Land Use). Brisbane’s annual emissions for 2023-24 were 65 per cent higher than the second place LGA, Isaac, which had emissions of 19.2 Mt of CO2-e in 2023-24.
Combined, the top ten highest emitting LGA’s within Australia represent 22.3 per cent of Australia’s annual emissions in 2023-24. The next ten LGA’s represent 9.0 per cent of Australia’s annual emissions. While the remaining 523 LGA’s account for around two thirds of Australia’s emissions.
The distribution of regional emissions shows that few LGA’s are responsible for a large proportion of Australia’s annual emissions from within their boundaries.
At the bottom end of the distribution, the LGA’s with the lowest emissions in 2023-24 are typically remote LGA’s with small populations, without any major business activity. This includes remote LGA’s in Queensland, South Australia and Northern Territory, many of which are aboriginal run councils with fewer than 1,000 residents across the entire LGA.
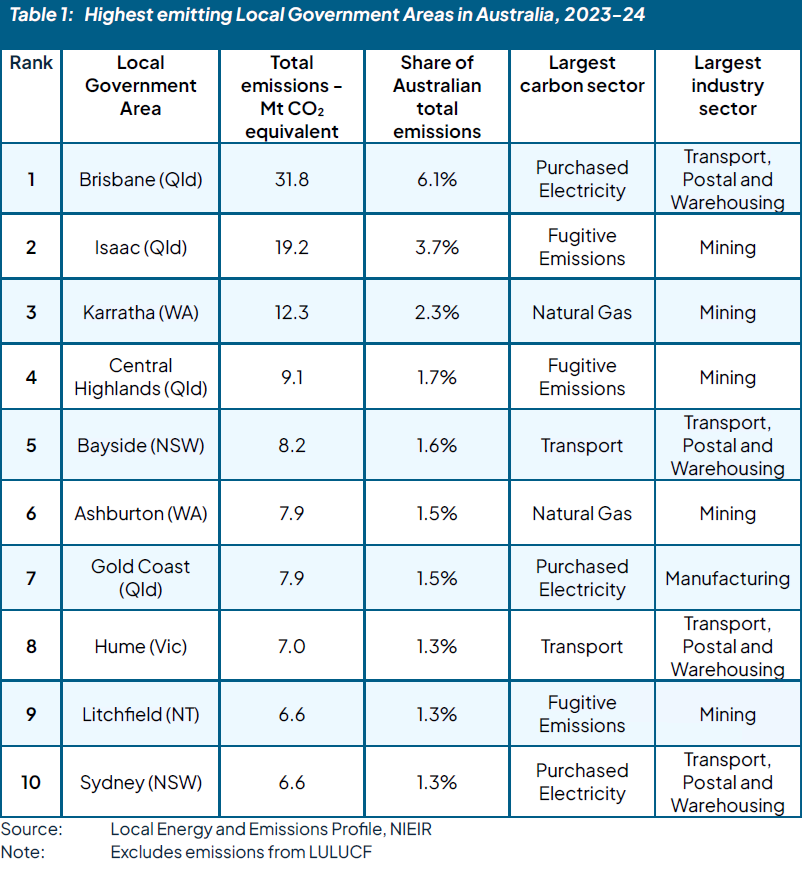
Table 1 Highest emitting Local Government Areas in Australia with detail, 2023-24
The Brisbane and Gold Coast LGA’s have the first and second highest populations within Australia so their emissions profiles are driven by large residential segments alongside diverse industry emissions. The Brisbane LGA alone contains around 5 per cent of Australia’s total population. Both the Brisbane and Gold Coast LGAs are not typical metropolitan LGAs, as they cover much larger than usual land areas. In contrast to other major metropolitan regions, such as Melbourne and Sydney, which are split up into much smaller LGA regions with lower populations.
Gold Coast is the only LGA within the list that contains a residential sector larger than any single industry. While all other metropolitan LGA’s from Australia’s 10 highest emitting regions have at least one industry sector with greater total emissions than the residential sector.
The Sydney LGA has a similarly diverse industry emissions profile with emissions spread out across multiple industries. Transport industry emissions are the largest segment with the Sydney LGA, marginally larger than the total residential sector emissions within Sydney. Note, that the residential sector also includes transport emissions from the use of personal transportation. The Sydney LGA also contains a large professional workforce with the highest National industry emissions from Financial and Insurance Services, and Professional, Scientific and Technical Services industries. Of these industries, purchased electricity is the largest source of emissions.
The regions with the highest emissions in 2023-24 typically have concentrated high-emitting industry within the region. The largest LGA’s are dominated by mining and transport industry emissions.
The mining industry is responsible for the most emissions within Australia out of any industry and any pathway to reduce emissions must consider the decarbonisation of the sector. In 2023-24, the mining industry was responsible for 21.2 per cent of Australia’s annual emissions, which is higher than the combined emissions from every single household within Australia (18.5 per cent of total).
The mining industry is an emissions intensive industry that has the second highest emissions output per dollar of industry gross product in Australia, second only to Agriculture. Over 2023-24, the mining industry contributed around 15 per cent to Australia’s industry gross product.
Note that the mining sector emissions do not include combustion of exported energy products such as coal and LNG, which are counted in the countries that use them for fuel, such as Australian exports of LNG to Japan’s LNG power stations. The mining sector is energy intensive, often in remote areas without access to the main electricity networks within Australia. Energy use includes electricity, natural gas and fugitive emissions (unintended leaks in oil and gas production, for example).
Hume and Bayside both have major transport hubs driving emissions, with the Hume LGA having the Melbourne Airport and Bayside containing the Sydney Airport. Each of these areas therefore have large non-residential transport emissions from air travel, freight and other commercial passenger transport, such as taxis and public transport with their LGAs. Both of these airports are each of the state’s major international airports.
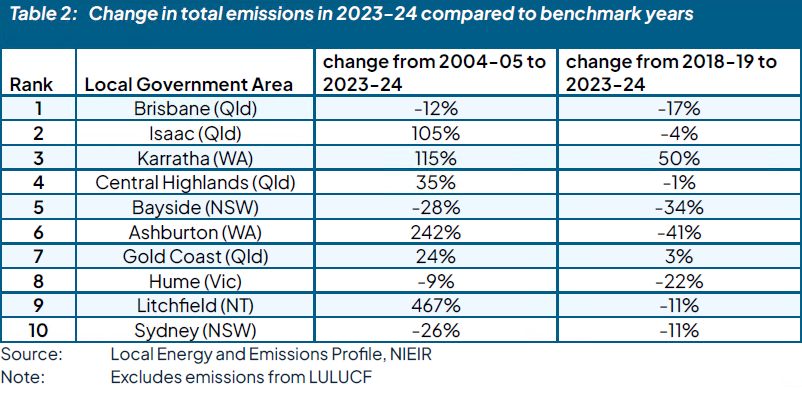
Table 2 – Change in total emissions in 2023-24 compared to benchmark years
Australia’s mining sector has experienced significant growth over the past 20 years. More recently, this has included significant development of the LNG export industry in Western Australia, Queensland and the Northern Territory. This is reflected in high emissions growth in Karratha, Ashburton and Litchfield, where there have been significant increases in Fugitive Emissions within each LGA as a result of industry growth in oil and gas extraction. Each of these LGA’s have increased their total emissions by 2 to 5 times since 2004-05. However, emissions are down in Ashburton and Litchfield since 2018-19, but have continued to increase in Karratha.
The mining industry itself can have volatile production output due to the nature of commodity markets, which is reflected in the long-term variability in their emissions profiles.
Emissions from Isaac have more than doubled since 2005 as the coal mining industry has expanded over the long term. The LGA currently contains around 30 active black coal mines (or around a quarter of all operational mines within Australia). This includes the Adani Carmichael coal mine, which opened in late 2021. The mines in Isaac are both metallurgical and thermal coal, which are used for smelting and power generation respectively. Coal from Isaac is used domestically and for export.
All of the mining industry concentrated LGA’s future emissions profiles depend on the demand in the export sector for Australian energy products. This includes international demand for fossil fuel power generation (coal and LNG), which will slow if other countries take stronger action on decarbonizing their electricity supply with renewables or other forms of generation. Domestic displacement of thermal coal is also possible with continued increases in solar and wind generation capacity. There is also expected to continue to be strong demand for metallurgical coal for steel production, in particular within China, until commercially viable renewable alternatives are available within the process.
Over the long term, Brisbane’s business and residential emissions have been trending downwards with the LGA’s total emissions down 12 per cent compared to 2004-05 levels (excluding Land Use). Other industry diverse population centres within the top 10 have also been trending downwards over the long term, including Sydney, Hume and Bayside. However, the Gold Coast LGA has increased by a total of 24.3 per cent. Most of the growth in Gold Coast emissions occurred pre-COVID, with levels stablising (but not dropping) over the past five years.
Sydney LGA emissions have been consistently trending downwards since around 2007-08, with total business and household emissions 26.3 below 2004-05 levels. Emissions continued to decrease immediately during the COVID-19 lockdown period, however, in the past two years Sydney LGA emissions have increased by around 10 per cent. Most of this growth is due to increase transport related activity, which now exceeds pre-COVID levels within the Sydney LGA.
Australia has set an interim target of National emissions reduction of 62 to 70 per cent below 2005 levels by 2035 on the pathway to net zero emissions by 2050. The ten highest emitting regions within Australia represent almost a quarter (22.3 per cent) of total annual business and residential emissions. In particular, many of these LGA’s have highly concentrated mining and transport industry sector emissions. Any emissions reduction plan requires action to address the high concentration of emissions from within these industries and regions.